
Landing Page Conversion Rate Optimization for Mobile Ad Traffic (2026)
 Ethan ColePublished on October 12, 2026 · in Guides
Most landing page conversion rate optimization on mobile ad traffic fails before the first test is launched. Not because the ideas are bad, but because the rate being optimized is measured against the wrong denominator, blended across traffic that behaves completely differently, or blamed on the page when the leak sits one step before or after it.
This guide is about paid mobile traffic from Meta, TikTok and Google sending people to a page whose job is one action: a sign-up, a lead form, an app or PWA install. It walks through the order that tends to work: fix the measurement, split the funnel, segment, then change the page, then test without fooling yourself.
What landing page conversion rate optimization actually optimizes
A landing page conversion rate is conversions divided by landing sessions, not by ad clicks. The difference matters more on mobile than anywhere else:
- Ad clicks are counted by the ad platform when someone taps the ad.
- Landing sessions are counted by your analytics only when the page has loaded far enough to run the tag.
- Conversions should be one clearly defined event per page, such as a form submit, a completed registration, or a confirmed install, not "any button tap".
If you divide by clicks, every redirect, slow first paint and accidental tap shows up as a "page problem". If you count several different events as conversions, a page that gets more low-intent taps looks better than a page that gets more real sign-ups. Pick one primary conversion per page and write it down before changing anything.
Step 1: Fix the denominator before you touch the page
Start with the ratio between ad clicks and landing sessions for the same campaign and date range. On mobile ad traffic it is normal to record somewhat fewer sessions than clicks, but a large gap is a loading or routing problem, and no headline rewrite will fix it.
|
Signal |
What it tells you |
Where the leak usually is |
|---|---|---|
|
Landing sessions far below ad clicks |
People tap but never see the page |
Redirect chains, slow server response, heavy first paint, tag firing late |
|
High bounce within 2–3 seconds |
The page appears but does not answer the ad |
Message mismatch, slow above-the-fold content, layout shift |
|
Many sessions, almost no scroll or CTA views |
The first screen is not doing its job |
Weak first screen, CTA below the fold, intrusive pop-ups |
|
CTA taps fine, conversions low |
The step after the page is losing people |
Long forms, store redirects, install prompts not available |
Two practical checks:
- Count redirects. Tracking links, short links and country routers each add a hop. On a slow mobile connection, every hop is a chance to lose the visitor. Keep the chain as short as your attribution setup allows.
- Check when your analytics tag fires. If it loads after a large script bundle, visitors who leave in the first two seconds never become sessions, and your rate looks better than reality while your click-to-session ratio looks worse.
Step 2: Split the funnel into stages
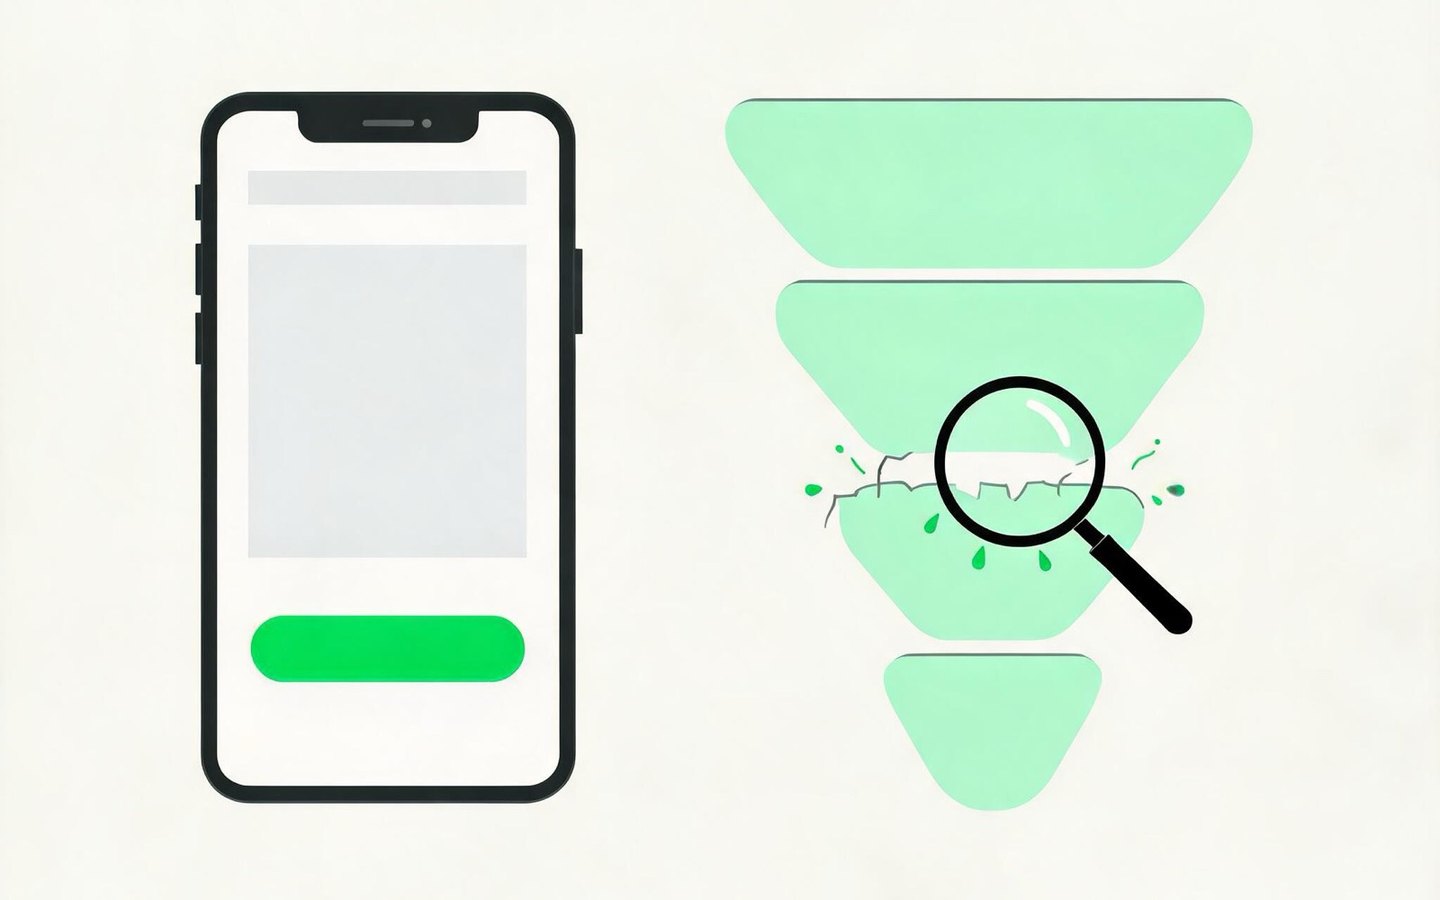
A single conversion rate hides where people drop. Break the path into stages and measure each one:
- Ad click
- Page rendered (landing session)
- First interaction: scroll, or the primary CTA becoming visible
- Primary CTA tap
- Destination step started: form opened, store page, install prompt shown
- Conversion confirmed
The stage with the biggest relative drop is where to work first. A page that loses 60% between stage 2 and 3 needs a better first screen. A page that loses 60% between stage 4 and 6 needs a shorter or more reliable destination step, and redesigning the hero section will not move it.
If the destination is an app or PWA install, the install step behaves differently on Android and iOS; the PWA landing page guide covers that flow in detail, and how to measure Add to Home Screen conversions covers which install events to count.
Step 3: Segment before you average
Blended averages are the most common reason landing page tests produce confusing results. Before deciding the page is weak, look at the rate by:
- Placement. Feed, Stories, Reels, search and audience-network traffic arrive with very different intent. One placement converting at a third of the others will drag the blended rate down without any page problem.
- Browser context. Traffic from Facebook, Instagram and TikTok usually opens inside the app's in-app browser, not in Chrome or Safari. Some browser features behave differently there (see the FAQ below).
- Country and network. Page weight that is fine on fast connections can be the main leak on slower mobile networks.
- Operating system and device class. Low-memory Android devices struggle with heavy pages and large scripts.
- New vs returning visitors. Retargeting traffic converts differently and should not be mixed into a test of a cold-traffic page.
If one segment is clearly worse, the fix may be routing or targeting, not the page itself.
Step 4: Change the page in order of evidence
Once you know which stage leaks and for whom, these are the changes that most often move the rate on mobile ad traffic, roughly in the order worth trying:
Speed and weight. Aim for the main content of the first screen to appear quickly on a mid-range phone over a mobile network. Replace autoplay hero video with a compressed image, defer non-essential scripts, and avoid large font files for a single headline. Check Largest Contentful Paint and layout shift on real mobile traffic, not only in a desktop lab test.
Message match. The first line on the page should repeat what the ad said, in similar words. If the ad says "track installs from every campaign" and the page opens with a generic company slogan, people assume they landed in the wrong place.
One primary action, within thumb reach. Put a single primary CTA on the first screen and repeat it after each content block. Secondary links compete with it; keep them few and visually quieter.
Shorter forms. Every field costs completions. Ask only for what the next step needs, use the right input types and autocomplete attributes so the phone keyboard and autofill help, and show errors inline next to the field.
Relevant trust signals. Place proof next to the action it supports: data handling notes near the form, platform and device compatibility near an install button, real customer logos or reviews only if you have permission to show them.
A reliable next step. If the CTA hands off to an app store, a payment page or an install prompt, test that hand-off inside the in-app browsers your traffic actually uses. A CTA that works in Chrome but does nothing inside a social app's browser looks like a page with a low conversion rate.
Step 5: Test without fooling yourself
Landing page tests on paid traffic go wrong in predictable ways:
- Split by traffic, not by time. Running version A this week and version B next week mixes in changes in auctions, creatives and audiences. Send both versions traffic at the same time.
- Change one meaningful thing. If you change headline, layout and form at once and the rate improves, you will not know which change to keep.
- Decide the sample size before you start. As a rough reference, detecting a lift from a 4% to a 5% conversion rate at the usual 95% confidence and 80% power needs on the order of 6,700 sessions per variant. Smaller lifts need far more.
- Run full weekly cycles. Weekday and weekend traffic convert differently. Stopping a test the first day it looks significant inflates false positives.
- Small budgets need bigger changes. If traffic is too low to detect a one-point lift, test bolder alternatives, such as a different offer framing or a different destination step, instead of button text.
Step 6: Check what happens after the conversion
A higher landing page conversion rate is only useful if the people converting are the people you wanted. Aggressive CTAs, pre-checked options or vague copy can raise the rate while lowering the share of visitors who complete registration, open the app a second time or make a first purchase.
Track at least one event after the conversion, such as first app open, completed onboarding or first purchase, and compare variants on that downstream rate too. When the two disagree, the downstream number is the one that pays for the traffic.
A short checklist
- One primary conversion event per page, defined in writing
- Click-to-session ratio checked per campaign; redirect chain kept short
- Analytics tag fires early enough to count fast exits
- Funnel split into stages, with the biggest drop identified
- Rates compared by placement, browser context, country and device before judging the page
- First screen repeats the ad's message and shows the primary CTA
- Forms trimmed to what the next step needs
- Hand-off step tested inside the in-app browsers your traffic uses
- Tests split by traffic, sized in advance, run over full weeks
- Variants also compared on a post-conversion event
FAQ
What is a good landing page conversion rate?
There is no single good number. It depends on the action (an install, a lead form and a purchase convert very differently), the traffic source and the market. Cross-industry averages vary widely between studies. A more useful benchmark is your own rate for the same placement, country and audience over time, and the gap between your best and worst segments.
Is landing page conversion rate optimization the same as CRO?
It is a subset. Conversion rate optimization covers every step of a site or app; landing page conversion rate optimization focuses on the single page paid traffic arrives on, and on the step immediately after it.
Why is my landing page conversion rate lower in the Facebook or TikTok in-app browser?
In-app browsers are embedded web views with their own limits. Pages often load without the visitor's usual cookies or saved autofill data, some downloads and pop-ups are restricted, and browser features such as the Android PWA install prompt are generally not available there. Test your full flow inside those browsers, and where a step cannot work, give clear instructions to open the page in the phone's default browser.
How long should a landing page test run?
Long enough to reach the sample size you set before starting, and at least one full week so weekday and weekend behavior are both included. If reaching that sample would take more than a few weeks, test a bigger change rather than letting a small test run indefinitely.
The short version
Landing page conversion rate optimization on mobile ad traffic is mostly a diagnosis job. Measure against landing sessions, split the path into stages, segment by placement and browser, and only then change the page, starting with speed, message match and a single clear action. Test changes side by side with a sample size decided in advance, and judge winners on what happens after the conversion, not only on the conversion itself.